Dojo Data Grid – Part 34: Customizing Cell Styles Based on Data
In a previous post, I showed how to set the row color based on data in the row. In this post, I’ll show how style a cell individually based on the data that it contains.
Dojo Data Grid Series
Dojo Grids in XPages — All Blog Posts
Formatter Function
The key to this solution is a formatter function, which is a client-side JavaScript function that can be used to process a grid cell. (See this post for another example of how to use it.)
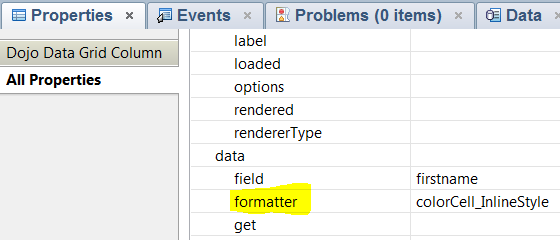
All you have to do is specify the name of the function on the grid column’s formatter property and and it will run on every cell as it is rendered. You can use a formatter function to modify the cell data or change the styling. The cell will display the value that is returned, to return the original value if you do not modify it.
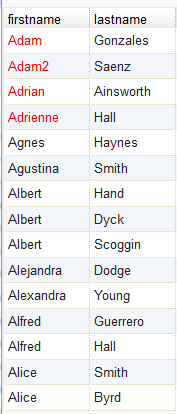
Below are examples formatter functions that use inline styles and CSS classes. Both use different approaches to change the font color to red if the name starts with ‘Ad’. The formatter function automatically receives a handle to the cell itself when its called, so you can use either the customStyles property or the customClasses property of the cell to modify the styles.
<script>
  function colorCell_InlineStyle(value, rowIndex, cell) {
    if (value.substr(0,2) == 'Ad') {
      cell.customStyles.push('color:red');
    }
    return value;
  }

  function colorCell_Class(value, rowIndex, cell) {
    if (value.substr(0,2) == 'Ad') {
      cell.customClasses.push('redCell');
    }
    return value;
  }
</script>